The first method that was attempted was a combination of a cost map and the held-Karp algorithm. Which is an algorithmic take on the travelling sales problem, where a salesman attempts to visit multiple cities in the shortest distance, and return to the same starting point.
A costmap is a type of map interpreted by the robot. Where costs are assigned to areas. Areas of high cost are red cyan and areas of low cost are purple. The aim of a cost map is that the robot avoids the areas of high cost while hitting areas of low cost.
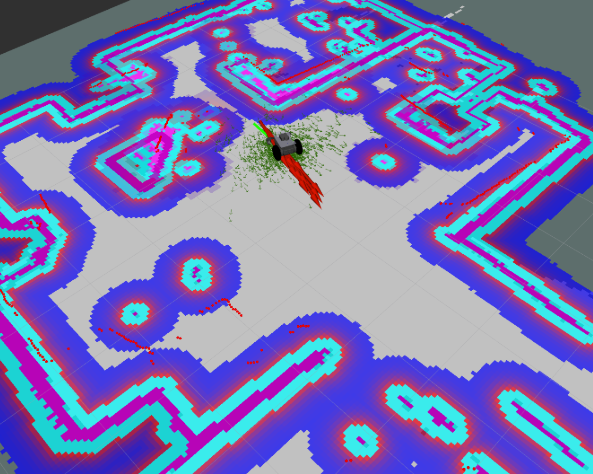
Example of a costmap
The cost map configurations are tuned in the Nav2 .yaml file , some key points about tuning::
- xy_goal_tolerance: 0.7
- yaw_goal_tolerance: 0.7
Goal checker, this allows a slight tolerance for the robot so that it can consider a goal reached even if it is slightly off. This avoids deadlocking in precise alignment.
- cost_scaling_factor: 5.0
- inflation_radius: 0.10
A higher cost scaling factor and a smaller inflation radius create a sharper cost gradient near obstacles, permitting the robot to navigate closer when safe. This gives Enhanced local maneuverability and responsiveness around obstacles.
These can be reverted to original values if the planner should be more conservative.
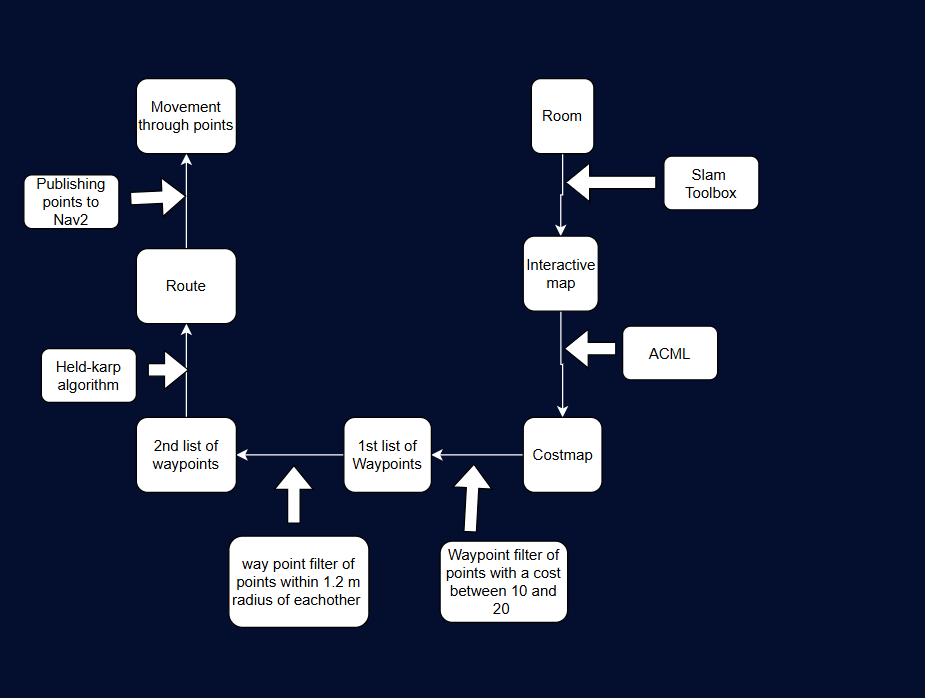
From the costmap, we can derive key way points that can then be published to the navigational node to allow the robot to physically move to those points. When initially setting a costmap, a filter can be applied to provide points within a particular radius of objects, i selected points between a cost of 10 and 20 on the costmap. The result of this is a map with many points. So this then needs to be filtered again. I filtered this map by removing points within a 1.2m radius of eachother, starting from the first point. this removes redunant points within close proximity and we are left with just a few waypoints left on the map. This chart shows the iteration through each stage, and the processes happening at each stage to accomplish the objective.
Waypoints plotted on the map:

The held Karp algorithm then uses each waypoint to plan a route. As you can see from the image, this is an iterative function which goes through every possibility. This algorithm guarantees the shortest route through the points.
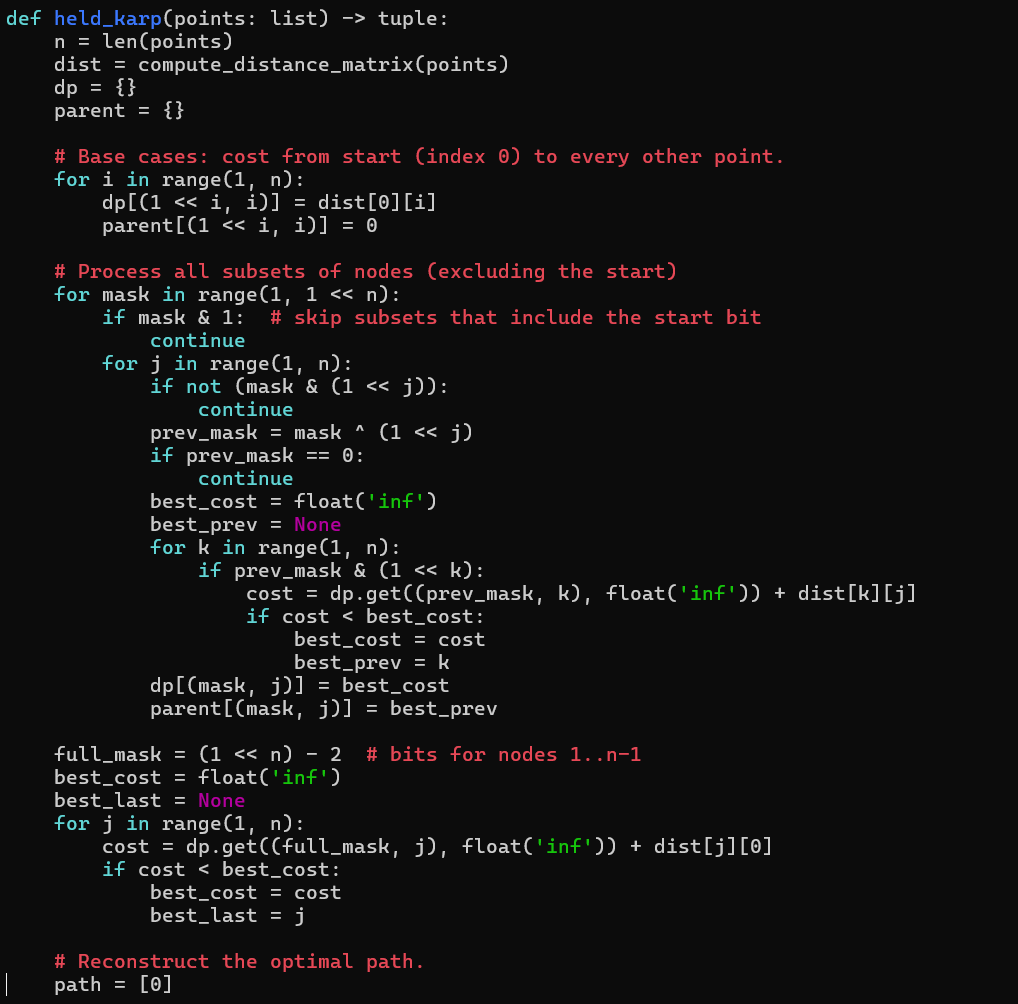
The result of employing these two strategies:
Route taken:
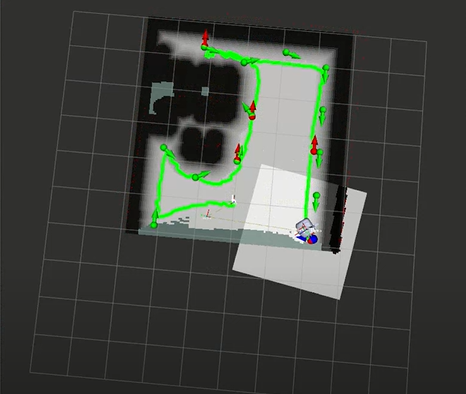
The path was ‘efficient’ but this begged the questions, how am i quantifying efficiency and how can i guarantee that each spot was sufficiently sanitised?